End-to-End Data Analysis Project: Part 3. Join and Stack
Sonny Torres, Tue 23 April 2019, Python
Sonny Torres, Tue 23 April 2019, Python
Contents
After scraping all of the CMBS loan data from the HTML file downloaded from the SEC.gov website (shown in my first post) and parsing the unwieldy header data (see my previous post), I now have to join all of the table data (which are saved as a bunch of CSV files) pieces and save the data as one CSV file. After joining all of the disparate data pieces the final data set will be one table and the data will almost be ready for analysis..
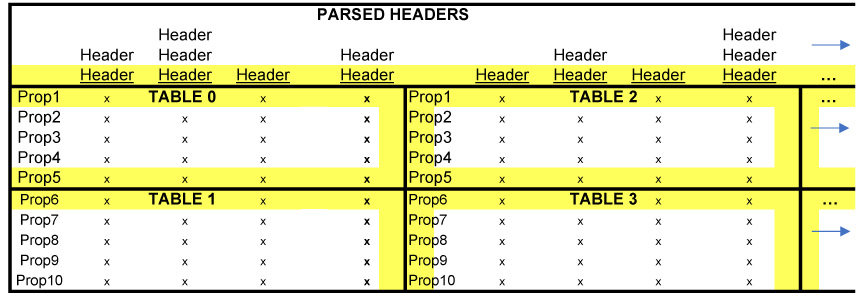
Below is an illustration that describes the join operations I will explain in this post.
The two main components of this data are:
import unicodedata
import pandas as pd
import re
import glob
import os

main_dir = r"C:\Users\Username\Desktop\End-to-End-Data-Analysis\1. Get the Data\table"
parsed_header_file = r"C:\Users\Username\Desktop\End-to-End-Data-Analysis\1. Get the Data\header\frame.csv"
os.chdir(main_dir)

pattern = '*table.csv'

all_table_files = [os.path.basename(file)
                   for file in glob.glob(os.path.join(main_dir, pattern))]

number_of_files = len(all_table_files)

df_top_half = []
df_bottom_half = []

def blank_rows(df):
    # selects first column, changes type to string,
    # initial type is object
    df[0] = df[0].astype(str)
    df[0] = df[0].map(lambda x: unicodedata.normalize('NFKD', x))
    blank_match = re.compile(r'\s+')
    i = [v for v in df[0].iteritems()]
    for tup in i:
        index, value = tup
        if re.match(blank_match, value):
            df.drop(index, axis=0, inplace=True)
    df.reset_index(inplace=True)
    df.drop(columns='index', inplace=True)

for num in range(0, number_of_files):

    file = str(num) + ' table.csv'
    df = pd.read_csv(file, encoding='ISO-8859-1', na_values='empty', header=None)
    blank_rows(df)
    if num % 2 == 0:
        df_top_half.append(df)
    else:
        df_bottom_half.append(df)

def join_frames(list_of_frames):
    # horizontal join of dataframes
    concat_df = pd.concat([obj for obj in list_of_frames], axis=1, join='inner')
    return concat_df

def final_stack_df(top, bottom, headers):
    top_tables = join_frames(top)
    bottom_tables = join_frames(bottom)
    final = pd.concat([top_tables, bottom_tables], axis=0, join='outer')
    headers = pd.read_csv(headers, encoding='ISO-8859-1')
    final.columns = headers.columns
    return final

cmbs = final_stack_df(top=df_top_half, bottom=df_bottom_half, headers=parsed_header_file)
cmbs.to_csv('CMBS Table.csv', index=False, encoding='ISO-8859-1')
The overall code structure (i.e. many helper functions to process data in CSV files) is similar to my previous post where I parsed the header data. Luckily, the table data is far less complicated and requires just one parsing function, blank_rows, while the rest of the script is simply appending the top half of the table to one list and the bottom half of the table to another list. In the table illustration shown earlier in this post, tables 0 and 2 would be the "top half" and tables 1 and 3 would be the "bottom half".
Because I have elaborated on similar code in Posts 1 & 2, I will break down the functionality of the code starting with the blank_rows function.
In my first post, the code was structured so that, with carefully considered criteria, a single header row would be identifiable and distinguished from other rows. For all other rows that didn't meet the special header criteria, they were considered table data and organized as such. However, in the HTML file, there are a few rows which are neither Had my code been built to recognize header and table data (IS NOT HEADER does not necessarily mean IS TABLE DATA), I would not have to delete blank rows in the table data CSV files.
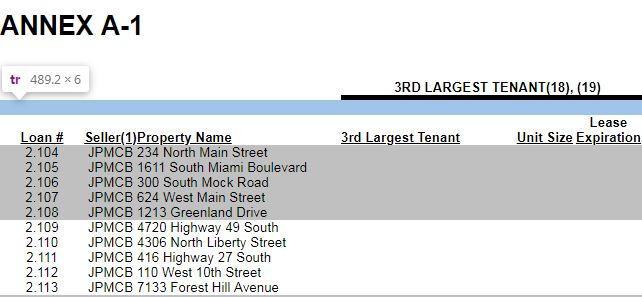
The blank lines are a result of hierarchal indexing that occurs on some of the header data where there is a hierarchal index, a blank row and then the header data (see image below).
So the goal for the blank_rows function is to identify if the first row, and only first row, is blank. If the first row is blank, that means the not header/blank row in the image above was saved as a table data CSV as if it were indeed table data. Due to some encoding inconsistencies, covered in Part 2, even finding a blank row requires a little more work than a binary True or False.
The 3 facts above, as well as the fact that the very top left element/cell of every table is consistent and will never be blank for a valid table row was considered when making the blank_rows function.
The blank_rows function below
def blank_rows(df):
    df[0] = df[0].astype(str)
    df[0] = df[0].map(lambda x: unicodedata.normalize('NFKD', x))
    blank_match = re.compile(r'\s+')
    i = [v for v in df[0].iteritems()]
    for tup in i:
        index, value = tup
        if re.match(blank_match, value):
            df.drop(index, axis=0, inplace=True)
    df.reset_index(inplace=True)
    df.drop(columns='index', inplace=True)
The function blank_rows accepts a dataframe with the df parameter and then immediately indexes the first column of the dataframe, converts the datatype to string and maps the unicode.normalize method to each element in the series (column). Again, indexing only the first column is necessary because this column, called 'Loan #', will never have any blanks for a valid row. Important note, you can only access the first column in a Pandas Dataframe with 0 because the Dataframe object was loaded with the pd.csv parameter header equal to None, meaning the headers, or column names, default to integers.
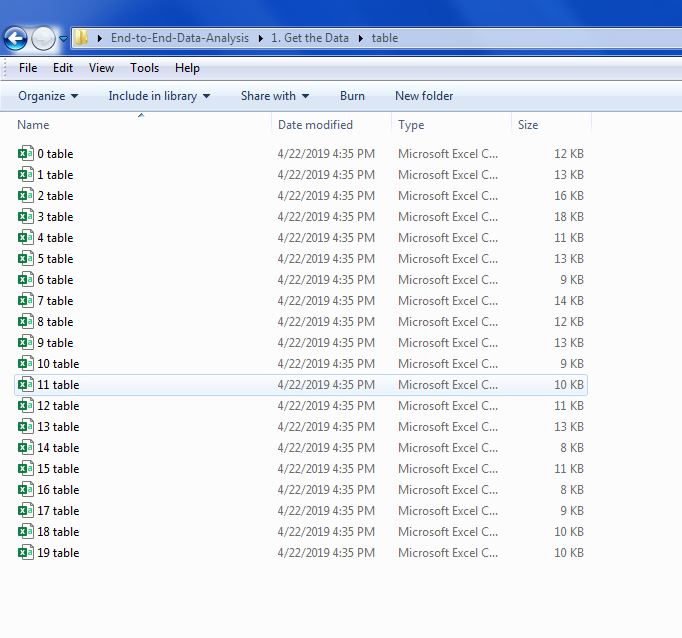
The directory with the table files, created in Part 1, should have produced a directory containing all of the table files like the image below.
The code below iterates over each file in the directory, appending the even numbered files to the df_top_half list and appending the odd numbered tables to the df_bottom_half list.
for num in range(0, number_of_files):

    file = str(num) + ' table.csv'
    df = pd.read_csv(file, encoding='ISO-8859-1', header=None)
    blank_rows(df)
    if num % 2 == 0:
        df_top_half.append(df)
    else:
        df_bottom_half.append(df)
Finally, now that the tools for processing the table files are ready, we can concatenate and stack all of the tables. Again, refer to the image presented earlier.
The lists df_top_half and df_bottom_half have lists of dataframes for the top and bottom half of the large table we are building. join_frames, the function below, simply horizontally joins the lists in the top half together to create one dataframe and does the same to the bottom half. So tables 0, 2, 4, 6, 8... would be just one table and tables 1, 3, 5, 7, 9... will be another table.
The function below concatenates the tables this way. axis=1 ensures that the tables will be concatenated along the 1 axis, which can be thought of as the X axis or horizontal axis, while the 0 axis can be thought of the Y or vertical axis. See this Stack Overflow post for more.
def join_frames(list_of_frames):
    # horizontal join of dataframes
    concat_df = pd.concat([obj for obj in list_of_frames], axis=1, join='inner')
    return concat_df
The next function below simply applies the join_frames function and then finally stacks the top half and bottom halves together.
def final_stack_df(top, bottom, headers):
    top_tables = join_frames(top)
    bottom_tables = join_frames(bottom)
    final = pd.concat([top_tables, bottom_tables], axis=0, join='outer')
    headers = pd.read_csv(headers, encoding='ISO-8859-1')
    final.columns = headers.columns
    return final
Finally, the final dataframe is created by utilizing the final_stack_df function and then saving the resultant dataframe to a CSV.
cmbs = final_stack_df(top=df_top_half, bottom=df_bottom_half, headers=parsed_header_file)
cmbs.to_csv('CMBS Table.csv', index=False, encoding='ISO-8859-1')
In the next post, I will refine and clean up the final dataset in order for it to be ready for analysis.