End-to-End Data Analysis Project: Part 1. Getting Data
Sonny Torres, Sun 23 December 2018, Python
Sonny Torres, Sun 23 December 2018, Python
Contents
After working with Python to manipulate and analyze commercial loan data at my job, I wanted to start a blog where I could showcase my programming projects. However, the loan data I used at my job was subject to copyright protection. Luckily, the Securities and Exchange Commission website publishes similar data.
My goals for this project were the following:
I will be detailing the process of parsing a messy HTML file with multiple tables and writing the data to CSV files. These files will be combined and cleaned in future posts. This particular post covers the following:
This is not a Python beginner-friendly post, however, I created visualizations where I thought they would help, included several website links throughout to reference some fundamental programming concepts and aimed to explain everything in detail while trying to keep things as simple as possible.
Link to repository here: Github.
The code in this post is primarily constructed with the main Python library (version 3.6), BeautifulSoup and a little bit of Regular Expressions.
To retrieve the HTML file that I used, you can download the HTML file hosted on my github page or you can visit the SEC url and press Ctrl + S to save the file as an HTML document.
Right-click on the link & save as an html file: Download
URL: https://www.sec.gov/Archives/edgar/data/1013611/000152153611000217/q1100154_fwpa1-jpm.htm
To view the webpage HTML, open the file or website in your browser and right click anywhere on the webpage and click "Inspect". Ctrl+Shift+I is the windows shortcut to do this.
Commercial Mortgage-Backed Securities (CMBS) are Bonds , or securities as they are sometimes called, backed by a group of commercial mortgages. Because the bonds are eventually sold on a public exchange, the issuers of the bonds are legally required to register the securities with the SEC and must comply with the Securities Act of 1933 by disclosing key due dilligence information for potential investors to evaluate. The public data I am working with in this blog post is the Annex A section of a prospectus. A CMBS prospectus informs potential investors of an investment opportunity (bonds of varying risk backed by mortgages) and the Annex A section tabulates the loan data as well as the commercial properties that serve as the collateral for the loans. The SEC data being used in this post covers one securitized pool, or group, of CMBS loans. There are 44 loans and 216 rows of data.
The individual CMBS data points included in the dataset fall into four main categories:
Despite being one data set, the CMBS data is arranged on the web page such that it is split into several vertically aligned tables. This is likely because the data set has over 100 columns and, if presented as a single data set, would require an inconvenient horizontal scrolling experience for the end user.
Because I wanted a single tabular data set, I had to first understand how the various tables were organized in order to put them together. The charts below illustrate how the first four tables are arranged and how they must be transformed in order to fit together as a single dataset like a CSV or excel file.
Below, are four tables with various headers, columns and rows. For simplification, the visuals below include only 10 Commercial Properties. Each column, which includes a data point for every row, is broken up into two separate tables. So, Properties 1-5 are in Table 1 and Table 2 lists the other 5 properties - Properties 6-10. Similarly, Table 4 is a continuation of Table 3.
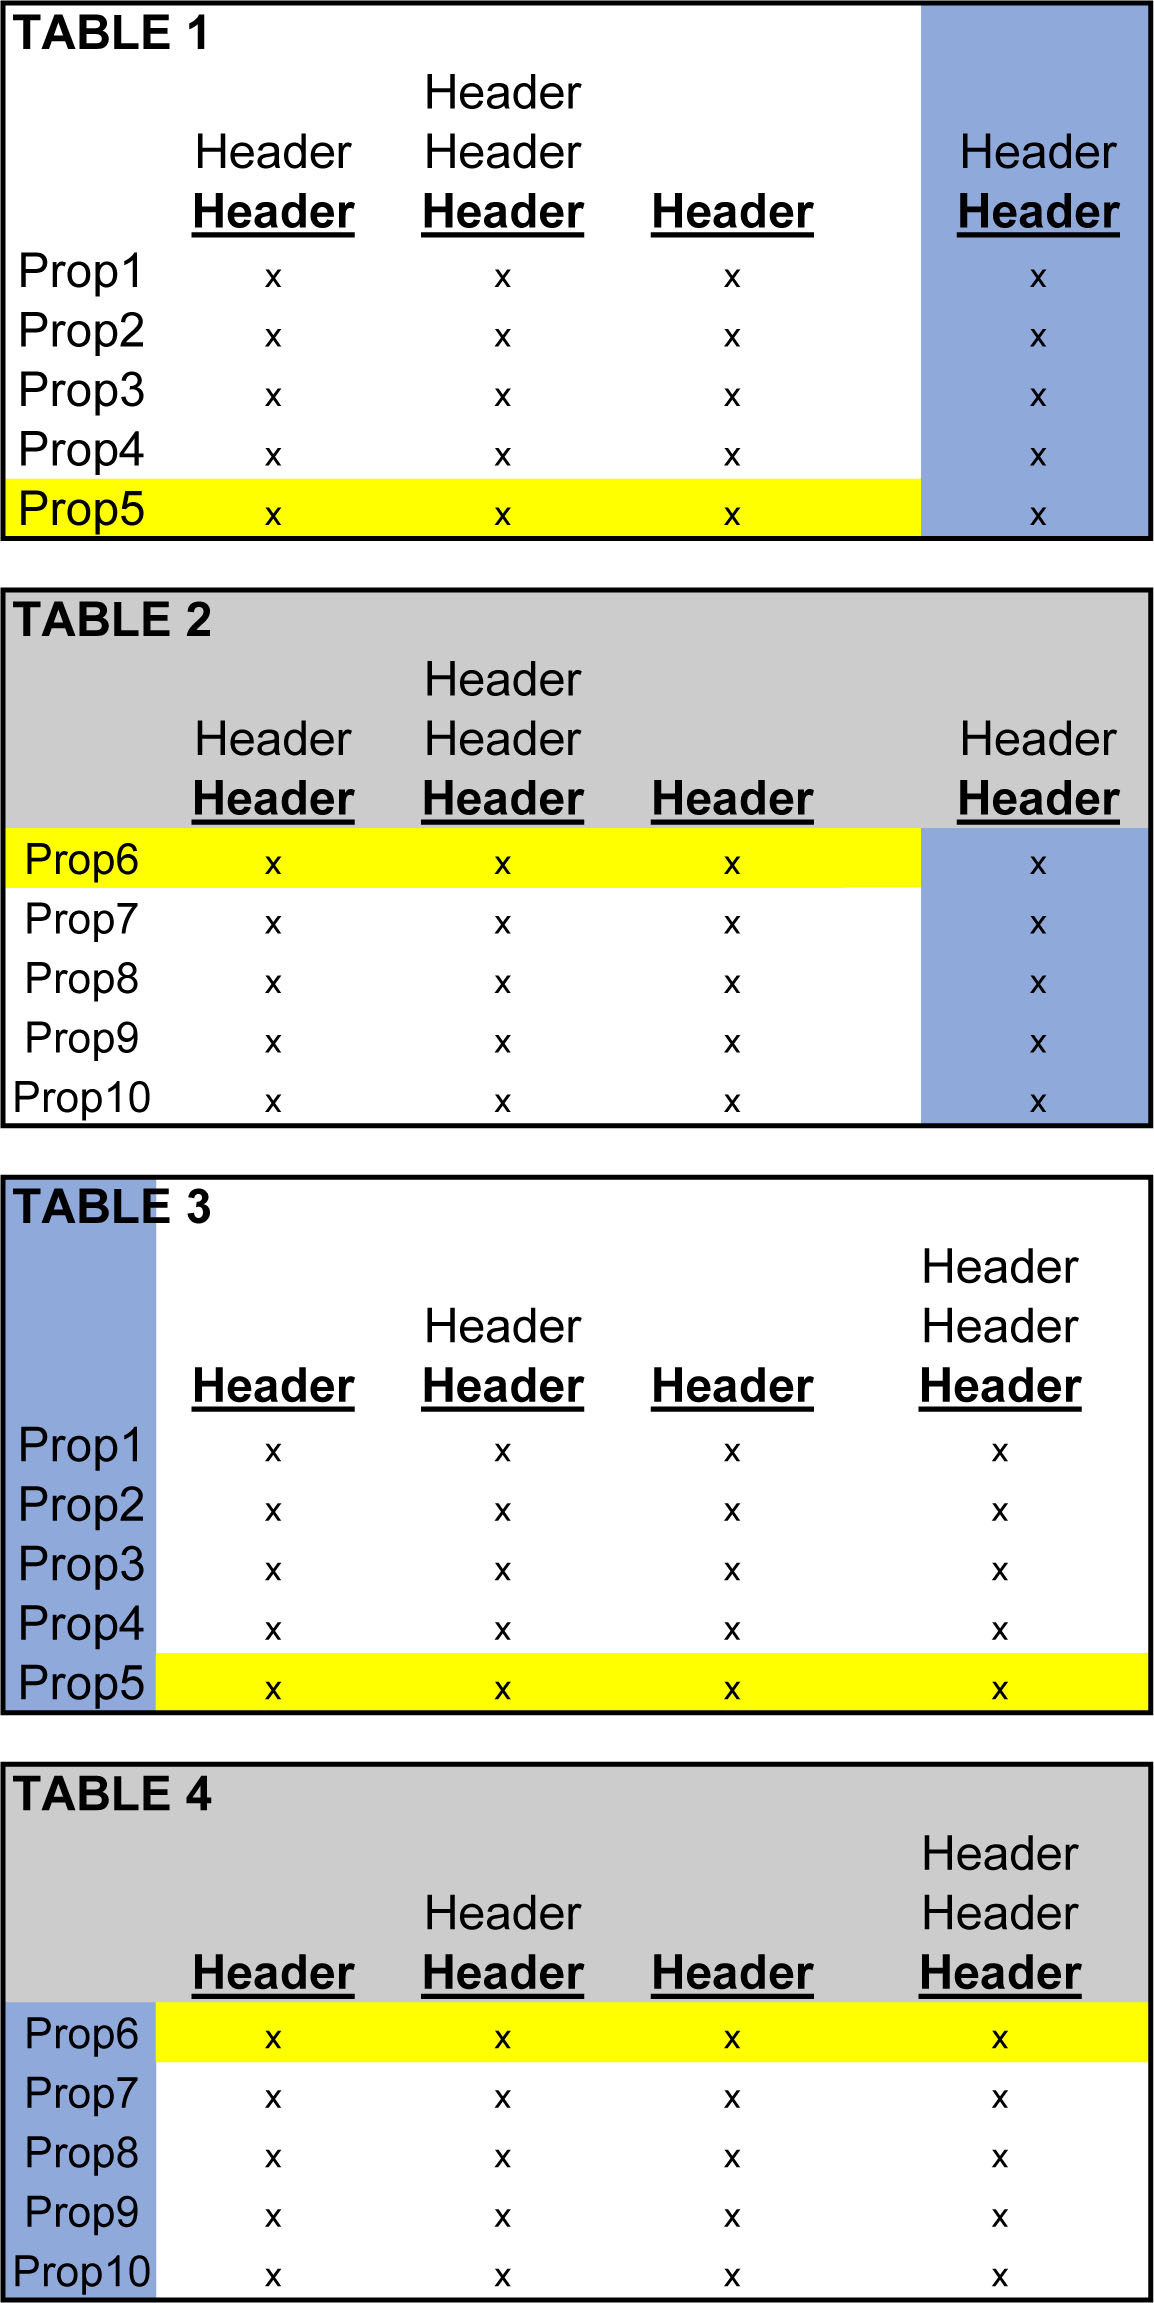
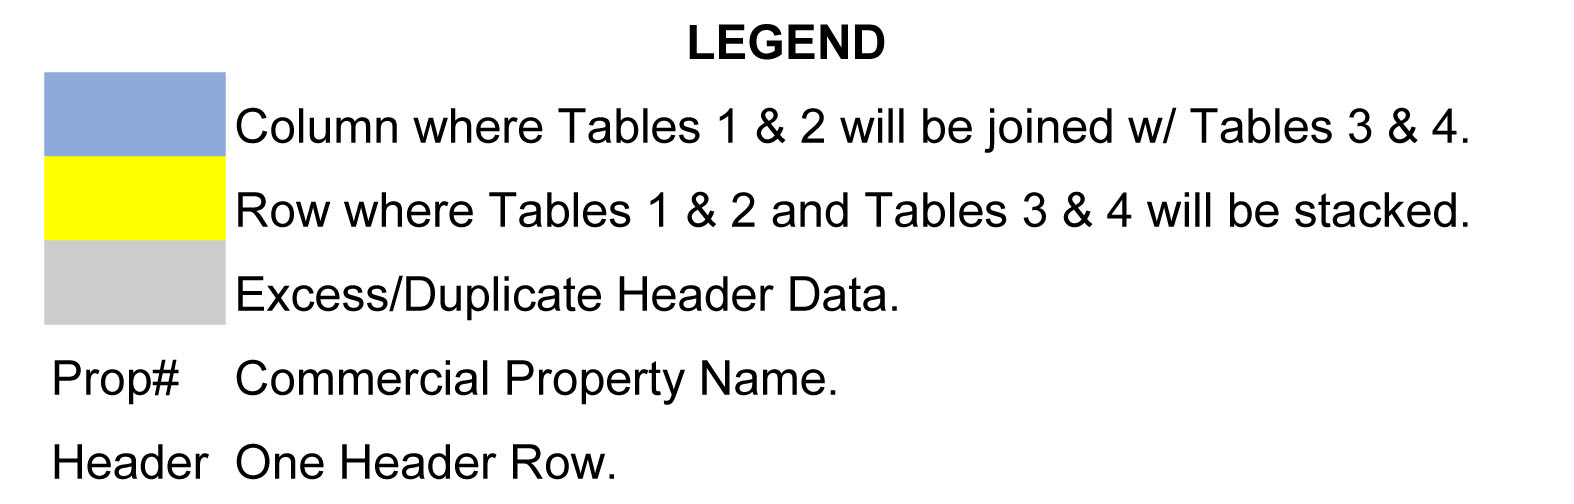
Tables 1 & 2 need to be glued together and 3 & 4 need to be glued together, both along their horizonal axes. Notice how the excess headers, (the grey-shaded headers in the above figure) have been eliminated in the figure below.
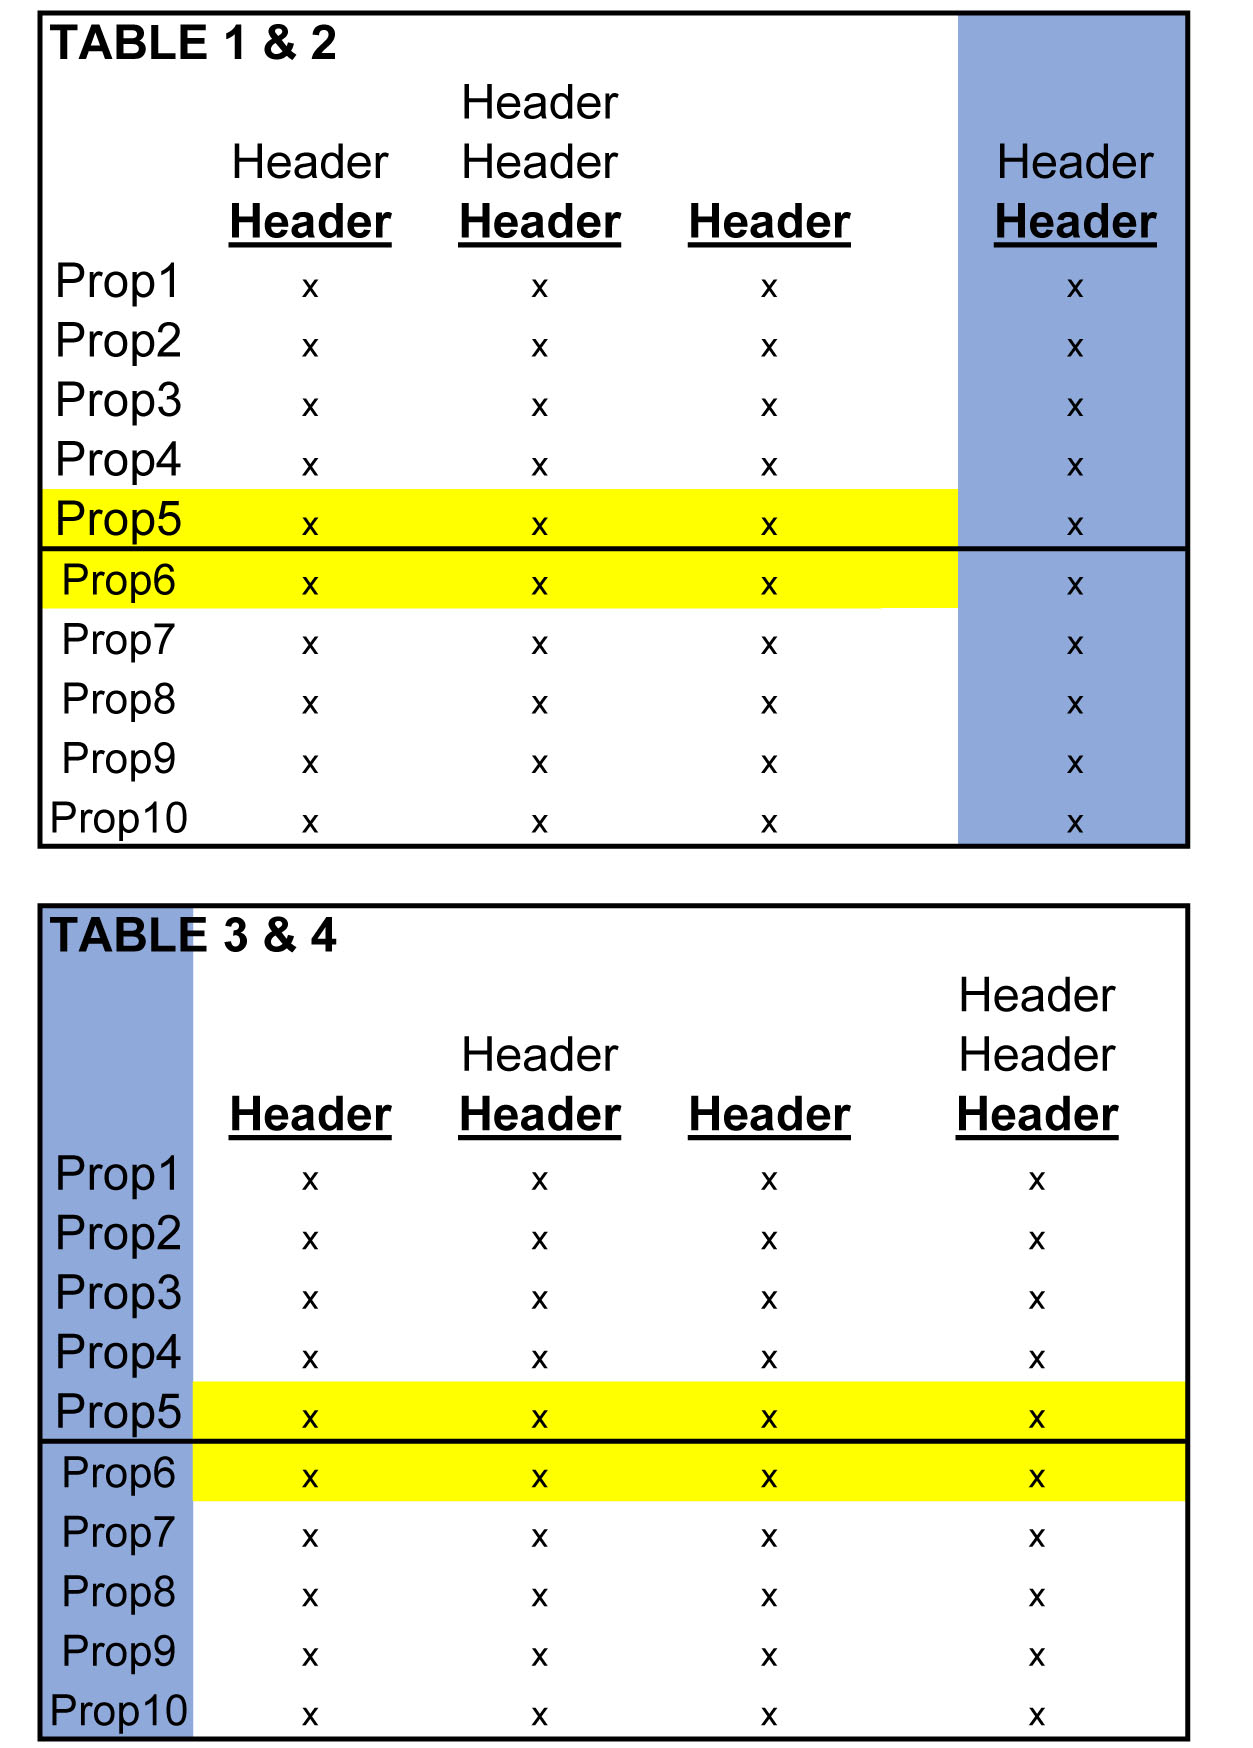
Next, the pairs of tables then have to be joined together on their respective vertical axes. Because "Prop1, Prop2..etc." represents not only commercial properties in the pool of mortgages, but are also the indices for every table, merging the data, as shown in the image below, will produce duplicate indices that must be deleted later.
When iteratively joining every 4 tables in this way, the result will be a single tabular dataset, albeit with plenty of clean up work left to do.
Although the data is not merged into a single data set in this post, assessing the layout significantly informed the way I approached the parsing and the writing of the data to files as you will see in this post. The tricky table layout actually pales in comparison, for me, to the complexity of parsing the header rows and creating rules to account for blank spaces in the table, which I will explain later in this post.
Before writing any code, I first had to carefully examine the HTML structure (Ctrl+Shift+I on windows to view the HTML followed by Ctrl+F to find keywords). The key to understanding the HTML, for me, was understanding the HTML tag structure, as well as what characteristics makes certain kinds of data unique, specifically what HTML tag attributes make a given row of data identifiable as being a header row, a data row or a row to skip.
Some HTML Table Basics:
More on HTML table structures here.
Below are the libraries I used for this task. The working_dir variable is the path that contains the html file and the name of the file is assigned to filename. I often use the os.chdir() method, out of preference, to direct my scripts to the appropriate directory but other methods work just as well.
from bs4 import BeautifulSoup
from bs4 import Tag
import pandas as pd
import shutil
import glob
import csv
import re
import os


working_dir = r'C:\Users\Username\Desktop\End to End Data Analysis Project'
os.chdir(working_dir)
filename = 'JPC11C05.html'
I used Python's with open syntax to create a file object which gave me the detail needed for parsing the HTML file at a granular, line by line, element by element level.
with open(filename) as sec:
    soup = BeautifulSoup(sec, 'lxml')
Each table of data is encased in table tags in the HTML document. However, there were tables that I did not want, specifically the table tags that consist of only footnotes (at bottom of HTML document). I noticed that these tables all had a border attribute within the main table tag (see below).
Good Table

Bad Table

So, I used a list comprehension to grab all the tables by targeting the table HTML tag and excluded all table tags with a 'border' tag attribute.
soup.findAll('table') returns a bs4.element.ResultSet which is a list of bs4.element.Tag objects - the table tags.
table_count stores the number of tables to iterate over.
tables = [
    table for table in soup.findAll("table") if 'border' not in table.attrs
    ]

table_count = len(tables)
Because the table headers came with their own unique challenges, I wanted to keep track of the headers and table rows separately. I first needed to see what distinguished the headers in the HTML.
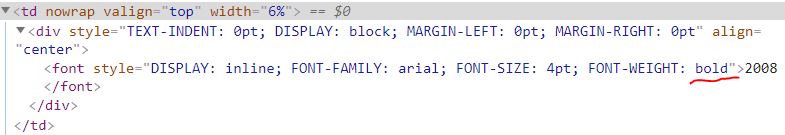
Embedded in the td tag, there is a font tag with a style attribute. I found that all header cells contained the word bold in the attribute value for the style attribute (see below) and the table rows never contained the bold tag attribute.
The function I made to identify headers has two parameters, tag and keyword.
def is_header(tag, keyword=r'bold'):
    # returns bs4.element.Tag or None
    return tag.find("font", {"style": re.compile(keyword)})
However, I wanted to exclude some of the header rows. Some of the tables have a hierarchal index structure where one large header row describes a group of columns (See "Hotel Operating Statistics" below).
The above "Bad Header" is differentiated in the HTML from the "Good Header" by having a large colspan attribute value. The "colspan" attribute tells us how many columns a given data point spans across. The HTML below shows that the "Hotel Operating Statistics" header has a colspan value of 15.
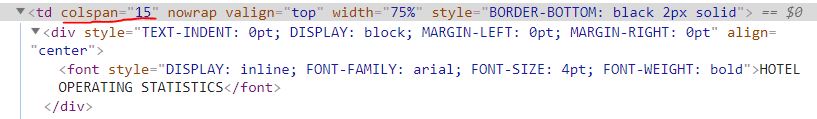
To be clear, in this HTML file, all colspan attributes are associated with headers but not all headers have a colspan attribute.
I then searched the HTML document manually in my browser, using Ctrl+f, for "colspan". There are only 20 instances of "colspan" in the entire HTML document and I saw that the highest colspan value for a good header was 2.
The function, unwanted_header(), below, will accept the tr tag as the argument for the tag parameter and the colspan_limit default value is set to 2, as a good header can have a colspan value of 2.
def unwanted_header(tag, colspan_limit=2):
    colspan_obj = tag.find("td", {"colspan": re.compile(r"\d+")})
    if colspan_obj:
        colspan_val = int(colspan_obj['colspan'])
        if colspan_val > colspan_limit:
            return True
        else:
            return False
Then I created a simple function to test for the previous two function's criteria at once.
def is_good_header(tag):
    if is_header(tag) and not unwanted_header(tag):
        return True
    else:
        return False
Before, I mentioned that there are some good headers with a colspan value equal to 2. These headers need to be identified in order to correct a problem they present.
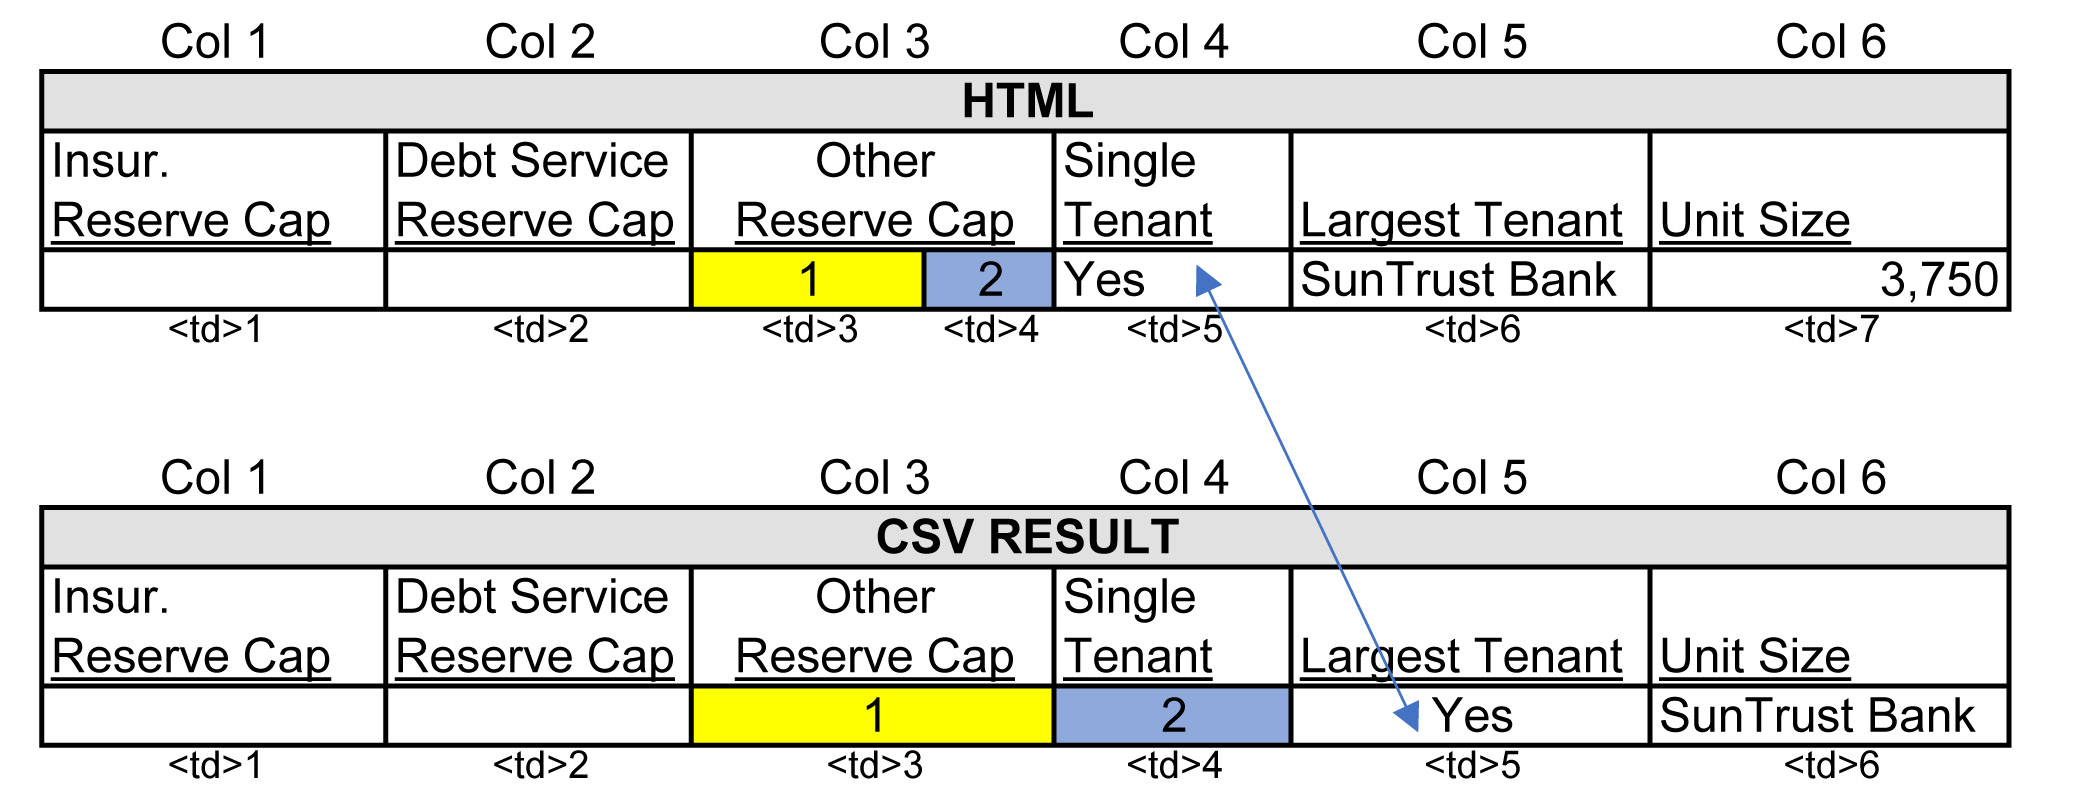
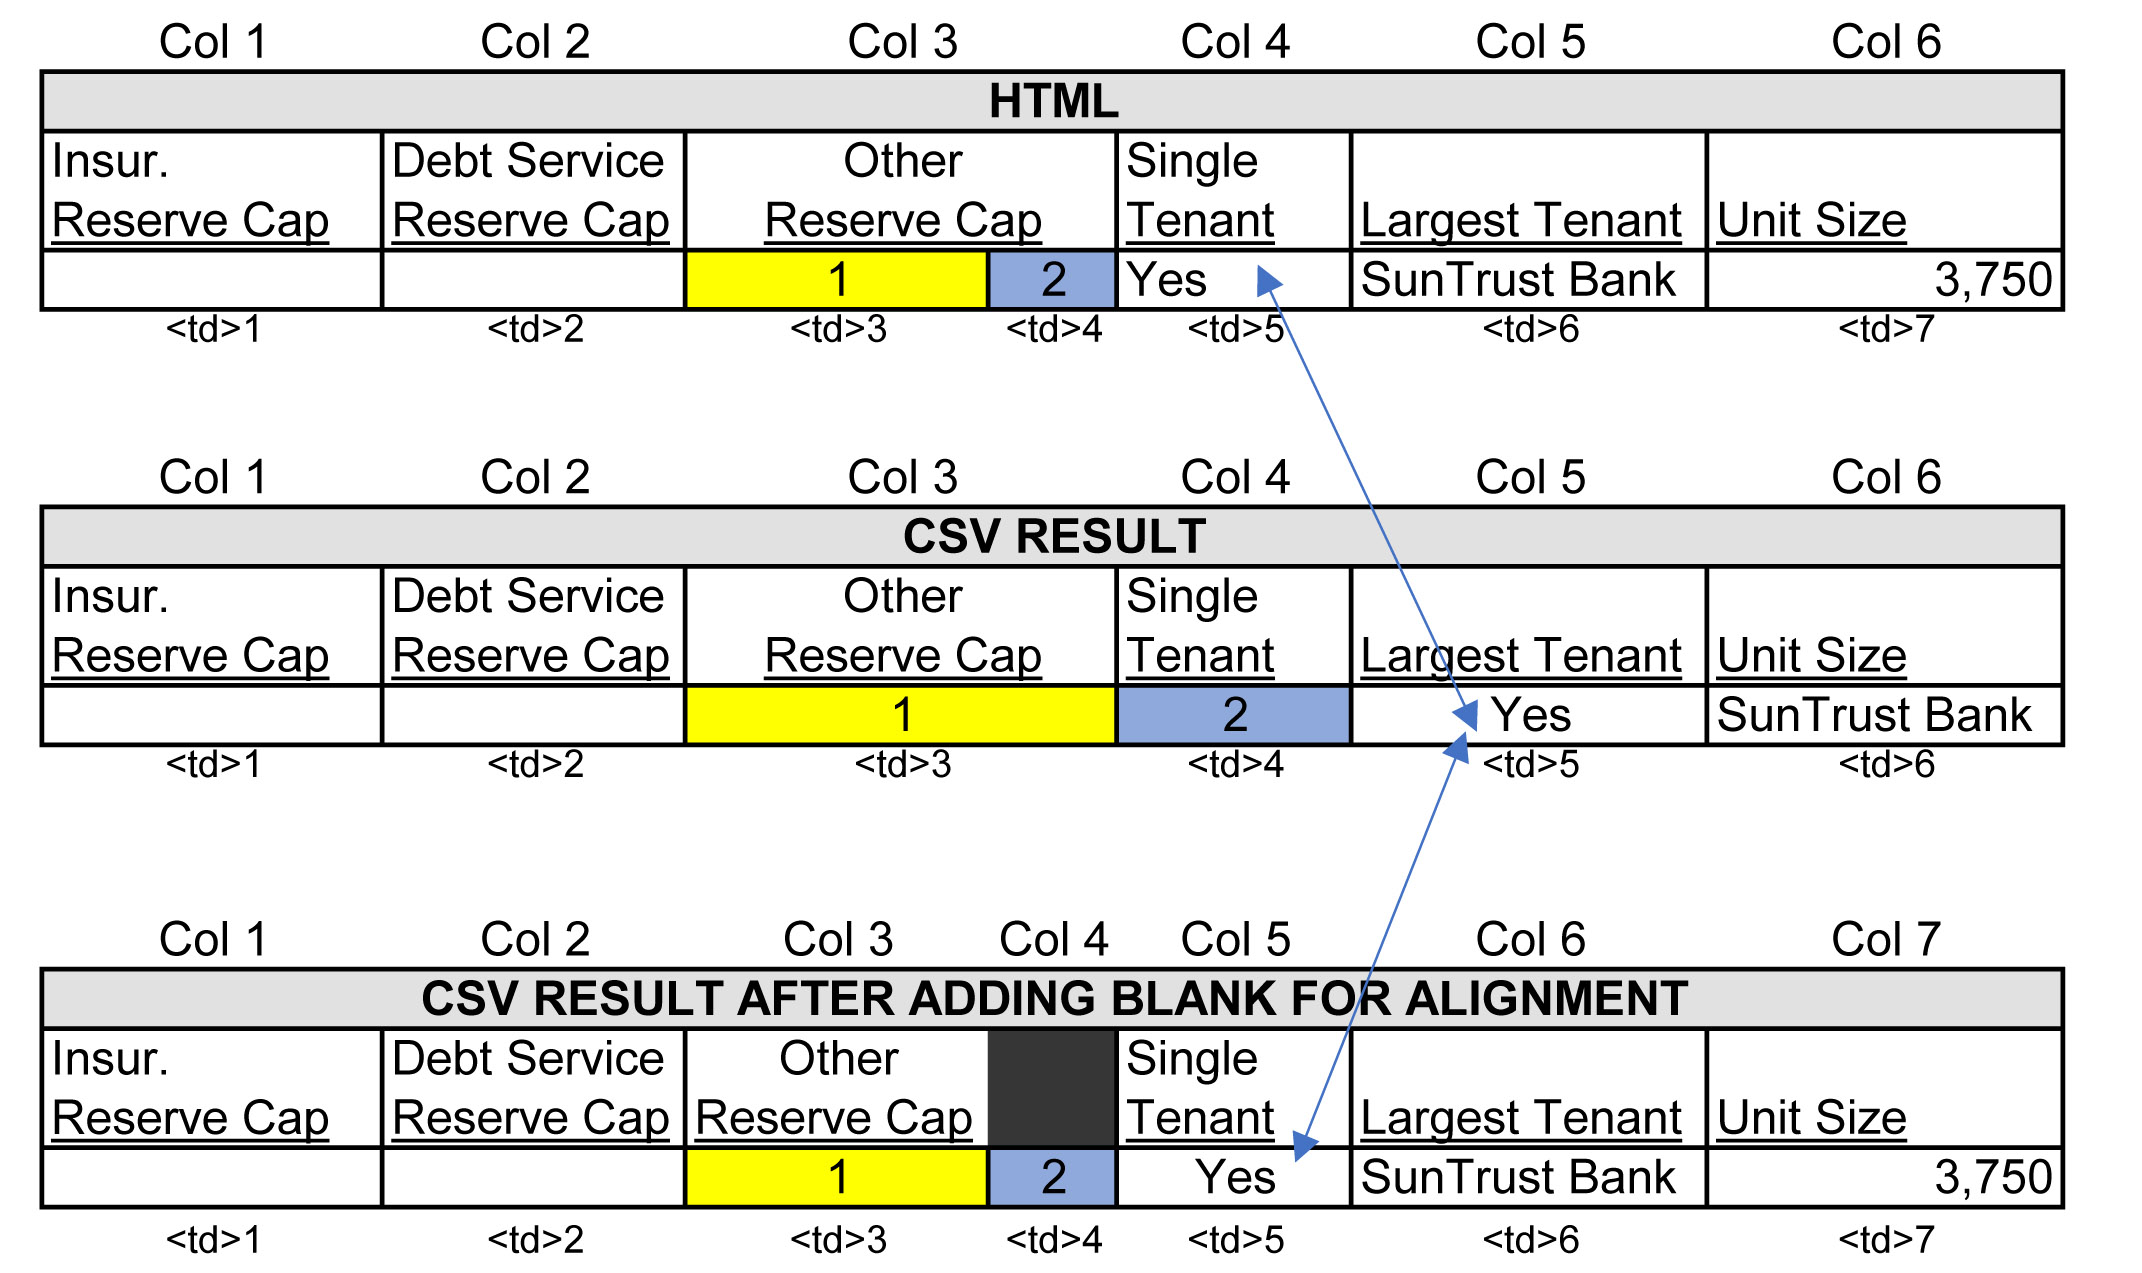
In the image below, the column "Other Reserve Cap" reflects how the website's tags are organized when a header value spans across 2 columns. A header value with a colspan attribute value of 2, "Other Reserve Cap", is enclosed in 1 td tag, while the rows of data below the header have 2 td tags (see picture for yellow and blue td tags). This 2-to-1 arrangement is not visible on the website and aligns appropriately in the HTML output, however, because my script iterates over every td tag and writes each one to a cell in my CSV file, I ran into a cell alignment problem illustrated in the figure below labeled "CSV Result". You can see how the "Single Tenant" cell is pushed over to the right by the yelllow and blue cells.
To identify the good headers with a colspan value of 2, I created a boolean function that returns True when all td tags span the same number of columns, 1 each, and returns False when they do not. Below is the boolean function cells_same_colspan().
def cells_same_colspan(colspan_dict):
    # reduce colspan dict values
    max_colspan_per_row = [max(val) for val in colspan_dict.values()]
    if max(max_colspan_per_row) == 1:
        return True
    else:
        return False
Below is an example of what the colspan_dict object, which is passed to the function above, would look like if a table had two rows and had a single colspan value equal to 2 in the second row.
# COLSPAN_DICT object

{0: [1, 1, 1, 1],
 1: [1, 1, 2, 1]}

# where the dict keys are table rows (including headers)
# and the dict values are lists containing
# each data point's colspan value
The function cells_same_colspan() would return False on the COLSPAN_DICT above and the row with the colspan value equal to 2 would need to be modified to align the table columns properly.
Like the book Infinite Jest, where the author's writing style can yield a page-long sentence with several tangential thoughts nested within the main thought, for the code to work the way I wanted, I created a number of nested objects. The data structures I used to track each piece of data (rows, data points, colspan values etc.), as well as the control structure of the main loop display a very layered, nested characteristic.
For example, nested_colspan_dict is a function, which I will elaborate on in a moment, that returns the dictionary object below. In the structure below, tuples are nested within lists nested within a dictionary. This structure is used to store all the information needed to make cell alignment corrections before they are written to a CSV file.
# NESTED_COLSPAN_DICT object
{0: [ (0, 1), (1, 1), (2, 1) ],
 1: [ (0, 1), (1, 1), (2, 1) ]}

# where the dict keys are table rows
# and the dict values are lists containing tuples
# each tuple contains..
# (index value of a given data point, the colspan value for given point)
Below is the function that produces the nested object.
def nested_colspan_dict(colspan_dict):
    nested_colspan_obj = {
        key: [colspan_tuple for colspan_tuple in enumerate(value)]
        for key, value in colspan_dict.items()}
    return nested_colspan_obj
Next, since I needed to extract data from the nested dictionary multiple times, it made sense to create a function to do this efficiently. This function iterates over the nested dictionary object and checks to see if a given colspan value does not equal 1 and returns the object's row number, index of colspan value and the colspan value.
def colspans_to_fix(nested_colspan):
    for key, value in nested_colspan.items():
        for tupl in value:
            #tuples are (colspan_index, colspan_value)
            if tupl[1] != 1:
                # key = row number
                # tuple = (index_of_cell, colspan_value_for_cell)
                yield {key: tupl}
Below are commonly used lines of code in Python when doing Input/Output (I/O) operations (see Python docs for working with CSV files ). I put these basic instructions into a function to curtail redundancy.
# A function to write the rows to a file.
def write_rows(current_table, filename, data):
    with open(str(current_table) + filename + '.csv', 'w', newline='') as f:
        writer = csv.writer(f)
        # if row avoids blank rows
        writer.writerows(row for row in data.values() if row)
After the main for loop finishes (shown after this function) there will be multiple CSV files generated in the program's directory. To organize the header and table files, the following function creates folders for each and moves the files into their respective folders.
def headers_tables(name, file_path=os.getcwd()):
    if not os.path.exists(name):
        os.mkdir(name)
    pattern = '*' + name + '.csv'
    file_list = [file for file in glob.glob(os.path.join(file_path, pattern))]
    for file in file_list:
        shutil.move(file, name)
The main portion of the script is a long for loop with multiple conditional statements to control the flow of the various instructions.
Below is the main script in one block of code, which I will expand on in pieces.
for i in range(table_count):

    table = tables[i]
    header_rows = {'headers': {}, 'tdata': {}}
    colspan = {}
    line_count = 0

    for row in table.findAll("tr"):
        colspan[line_count] = [int(td_tag['colspan'])
                               if 'colspan' in td_tag.attrs else 1
                               for td_tag in row.findAll('td')]
        if is_good_header(row) and i % 2 == 0:
            header_rows['headers'][line_count] = [data.font.text
                                                  if isinstance(data.font, Tag) else ''
                                                  for data in row.findAll('td')]
            line_count += 1
        elif is_header(row) is None:
            header_rows['tdata'][line_count] = [data.font.text
                                                if isinstance(data.font, Tag) else ''
                                                for data in row.findAll('td')]
            line_count += 1
        else:
            continue
    if cells_same_colspan(colspan):
        write_rows(current_table=i, filename=' header', data=header_rows['headers'])
        write_rows(current_table=i, filename=' table', data=header_rows['tdata'])
    else:
        nested_cs = nested_colspan_dict(colspan)
        bad_colspans = [cs for cs in colspans_to_fix(nested_cs)]
        headers_only = [h for h in header_rows['headers']]
        for colspan_dict in bad_colspans:
            for k, v in colspan_dict.items():
                row_index = k
                colspan_ind, colspan_val = v
                colspan_minus_one = colspan_val - 1
                index_for_insert = colspan_ind + 1
                if row_index in headers_only:
                    headers = header_rows['headers'][row_index]
                    for insert in range(colspan_minus_one):
                        headers.insert(index_for_insert, '')
                else:
                    rows = header_rows['tdata'][row_index]
                    for insert in range(colspan_minus_one):
                        rows.insert(index_for_insert, '')
        write_rows(current_table=i, filename=' header', data=header_rows['headers'])
        write_rows(current_table=i, filename=' table', data=header_rows['tdata'])
Before expanding on the for loop, I want to cover the main objects that are created for each iteration.
# headers_rows

{'headers': {0: ['a', 'b', 'c'],
             1: ['d', 'e', 'f']}
 'tdata':   {2: ['g', 'h', 'i'],
             3: ['j', 'k', 'l']}
}

# 'headers' is the key for the header dictionary and 'tdata' is the key for the table dictionary.
# 'headers' contains all headers for one table and 'tdata' contains all table data for one table.
# Each integer, above, represent a row number.
# Each list represents a row.
# Each letter represents a data point in a row.
for i in range(table_count):

    table = tables[i]
    header_rows = {'headers': {}, 'tdata': {}}
    colspan = {}
    line_count = 0
for row in table.findAll("tr"):
    colspan[line_count] = [int(td_tag['colspan'])
                           if 'colspan' in td_tag.attrs else 1
                           for td_tag in row.findAll('td')]
After recording the colspan values, the row or tr tag will be passed to the boolean is_good_header() function.
if is_good_header(row) and i % 2 == 0:
    header_rows['headers'][line_count] = [data.font.text
                                          if isinstance(data.font, Tag) else ''
                                          for data in row.findAll('td')]
    line_count += 1
elif is_header(row) is None:
    header_rows['tdata'][line_count] = [data.font.text
                                        if isinstance(data.font, Tag) else ''
                                        for data in row.findAll('td')]
    line_count += 1
    else:
        continue
if cells_same_colspan(colspan):
    write_rows(current_table=i, filename=' header', data=header_rows['headers'])
    write_rows(current_table=i, filename=' table', data=header_rows['tdata'])
This next section was pretty tricky for me. When cells_same_colspan() returns False, meaning their is a colspan value larger than 1, then a cell alignment issue is present and must be corrected.
else:
    nested_cs = nested_colspan_dict(colspan)
    bad_colspans = [cs for cs in colspans_to_fix(nested_cs)]
Because the header data and table data are handled separately, headers_only extracts only the header data which will be referenced later.
headers_only = [h for h in header_rows['headers']]
This last section essentially loops over the bad_colspans list and uses the information contained in it to modify the data container headers_rows.
for colspan_dict in bad_colspans:
    for k, v in colspan_dict.items():
        row_index = k
        colspan_ind, colspan_val = v
Continuing down the for loop, you will see two variables with + 1 and - 1. Because the script is structured so that one td tag will be written to one cell in excel, I gave each data point a default value of 1, unless the td explicitly showed, via a "colspan" attribute, that the colspan value was a number greater than 1. To be clear, the colspan value of 1 is only a "dummy" variable to tell Python that the data point is ready to be written to a CSV file.
colspan_minus_one = colspan_val - 1
index_for_insert = colspan_ind + 1
if row_index in headers_only:
    headers = header_rows['headers'][row_index]
    for insert in range(colspan_minus_one):
        headers.insert(index_for_insert, '')
else:
    rows = header_rows['tdata'][row_index]
    for insert in range(colspan_minus_one):
        rows.insert(index_for_insert, '')
Lastly, after the cell alignment issues are taken care of, the write_rows() function is used to write the data to a CSV file. Calling the headers_rows() with the string arguments 'header' and 'table' will create directories for each and will move the respective files to their directory.
        write_rows(current_table=i, filename=' header', data=header_rows['headers'])
        write_rows(current_table=i, filename=' table', data=header_rows['tdata'])

headers_tables('header')
headers_tables('table')
There should now be, in the directory you ran the script, 19 Header CSV files and 19 Table CSV files. The next post will combine all the CSV files and clean up the data.